29–30 September 2026 UTC · Download PDF · Per-trial data (JSON)
Scroll tables and charts sideways to see both devices.
Test systems
| Test system | MacBook Pro | iPad mini |
|---|---|---|
| Processor | M4 Pro, 14 cores | A17 Pro, 6 cores |
| Memory | 48 GiB | 7.72 GiB reported |
| OS | macOS 26.2 (25C56) | iPadOS 26.7 (23H24) |
| Python | 3.13.3 | 3.13.15* |
| Host / worker | CLI host / native sidecar | SwiftUI host / app extension |
| Build | Swift 6.3.3, optimized | Swift 6.3.3, Release |
*The iPad Python version was read from the pinned framework header.
Receipt latency
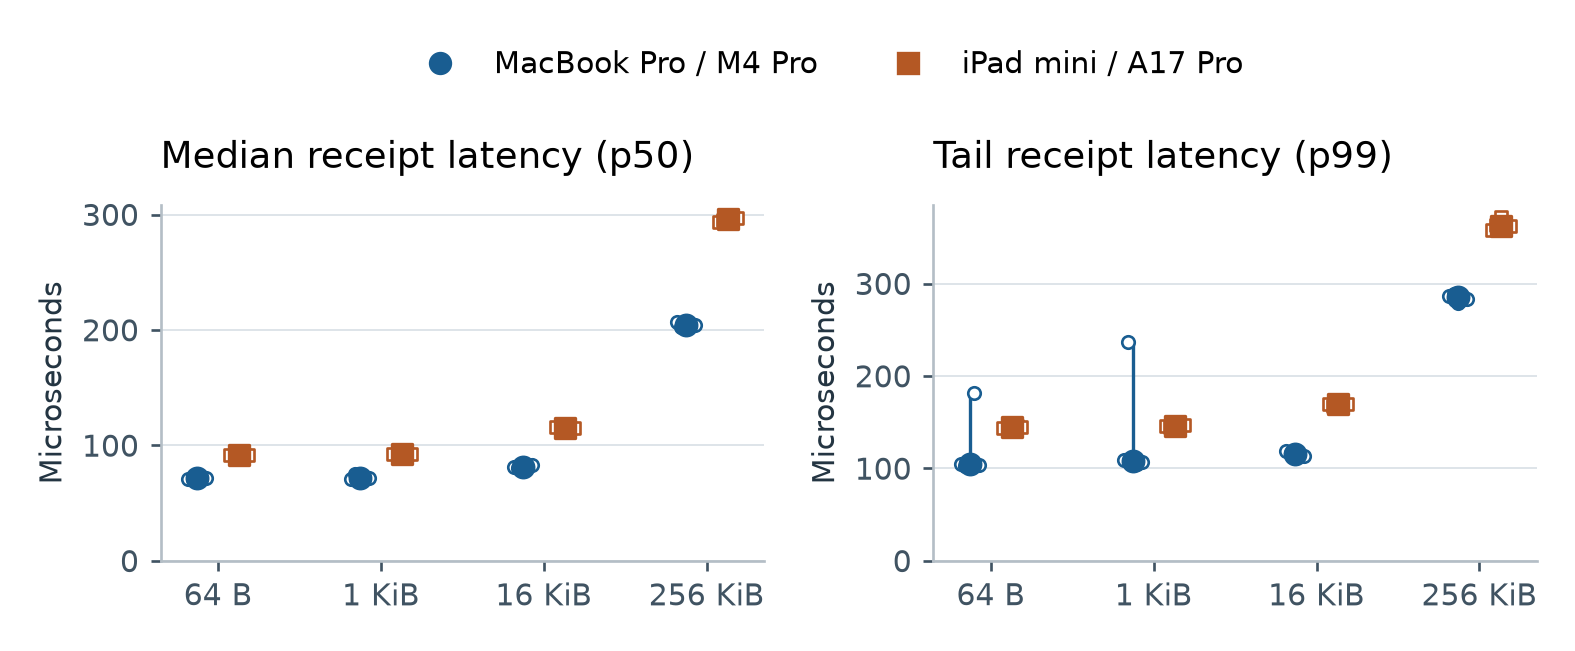
| Payload | Mac p50 | Mac p95 | Mac p99 | iPad p50 | iPad p95 | iPad p99 |
|---|---|---|---|---|---|---|
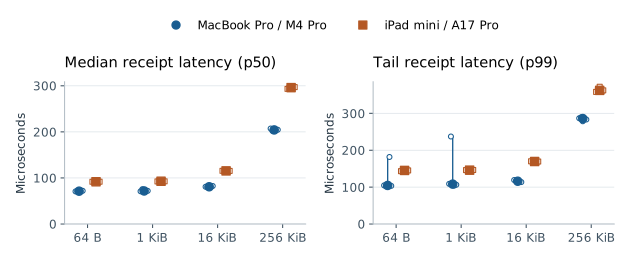
| 64 B | 71.3 | 90.5 | 104.6 | 91.8 | 125.6 | 145.3 |
| 1 KiB | 71.8 | 91.8 | 108.2 | 92.8 | 126.2 | 146.1 |
| 16 KiB | 80.9 | 102.0 | 116.0 | 115.3 | 148.9 | 169.4 |
| 256 KiB | 204.2 | 250.1 | 285.9 | 296.0 | 326.5 | 362.3 |
Table 1. Microseconds, medians of trial percentiles. Timing ends when Swift receives the complete Python echo. Payload verification and acknowledgement follow that timestamp.
Verified transfer throughput
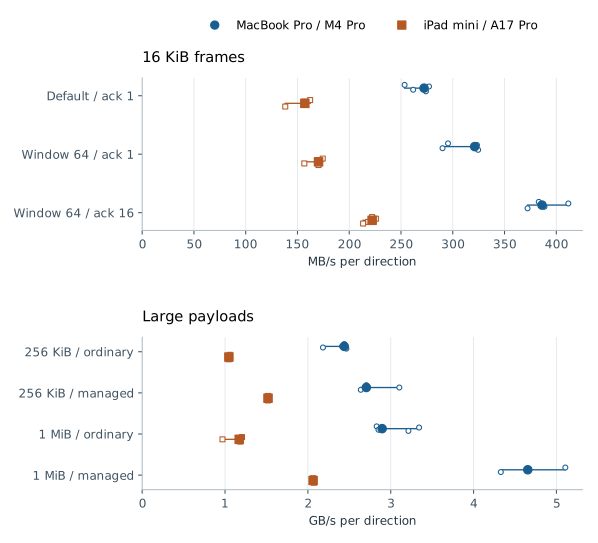
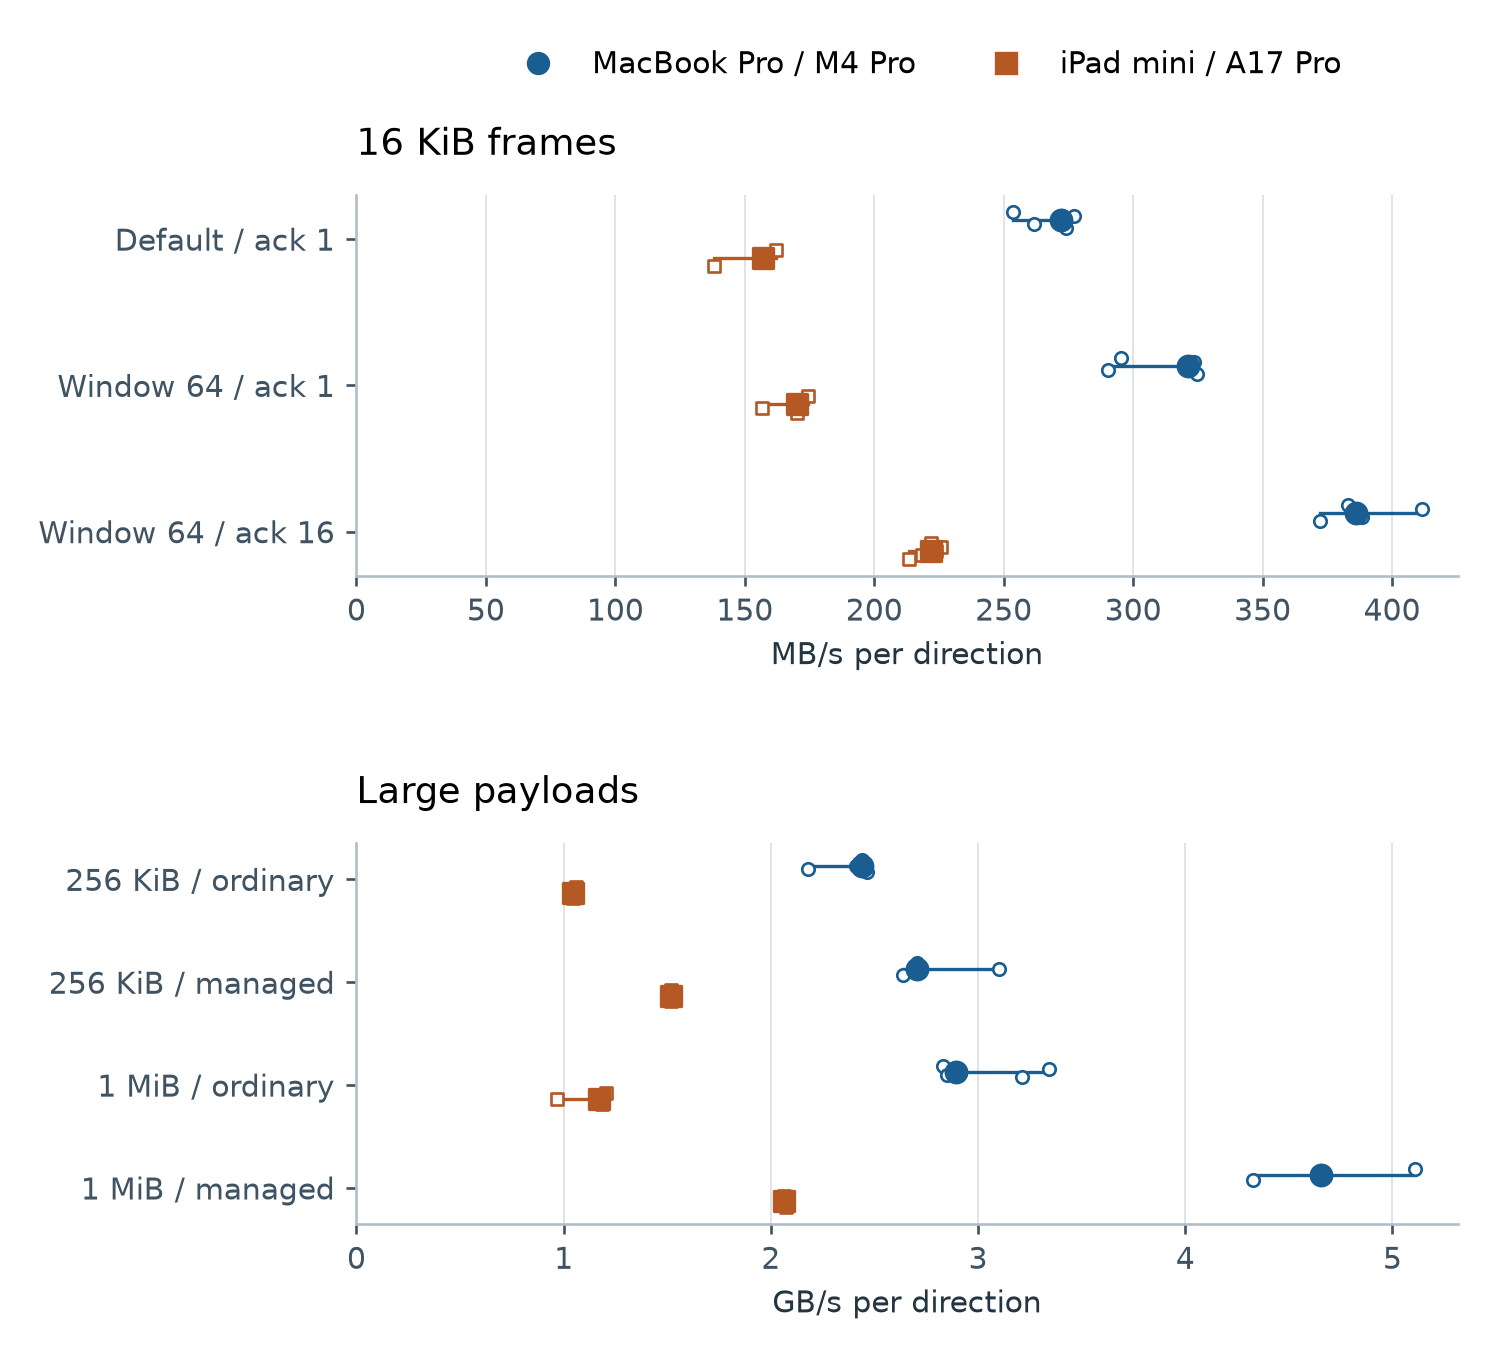
Swift sends while Python returns the received bytes. The reported rate counts bytes in one direction; combined traffic is twice that rate. Timing includes full output verification and acknowledgement.
| Payload / frame window / ack | Mac MB/s | iPad MB/s | n |
|---|---|---|---|
| 16 KiB / default / 1 | 272.3 [253.5, 277.1] | 157.1 [138.2, 162.3] | 5 |
| 16 KiB / 64 / 1 | 321.1 [290.1, 324.5] | 170.3 [156.6, 174.4] | 5 |
| 16 KiB / 64 / 16 | 386.2 [372.2, 411.6] | 222.1 [213.4, 225.8] | 5 |
| 256 KiB / 16 / 4 | 2,438.5 [2,181.8, 2,464.5] | 1,046.5 [1,043.1, 1,058.6] | 5 |
| Managed 256 KiB / 16 / 4 | 2,705.6 [2,638.6, 3,103.5] | 1,518.8 [1,516.3, 1,523.5] | 3 |
| 1 MiB / 16 / 4 | 2,896.0 [2,829.9, 3,342.1] | 1,171.1 [969.0, 1,204.8] | 5 |
| Managed 1 MiB / 16 / 4 | 4,654.0 [4,328.9, 5,107.3] | 2,062.7 [2,057.9, 2,071.5] | 3 |
Table 2. Median [minimum, maximum], decimal MB/s per direction. n is the number of trials on each device. Default output credit is 64 KiB; the 64-frame setting at 16 KiB permits 1 MiB. Ack is the number of output frames between acknowledgements.
At 1 MiB, managed ingress measured 4.654 GB/s on the Mac and 2.063 GB/s on the iPad, including echo processing and full byte comparison.
Concurrent sessions
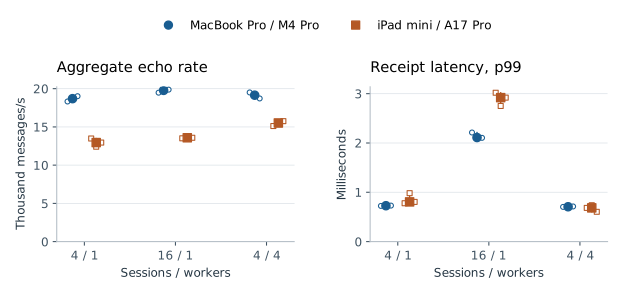
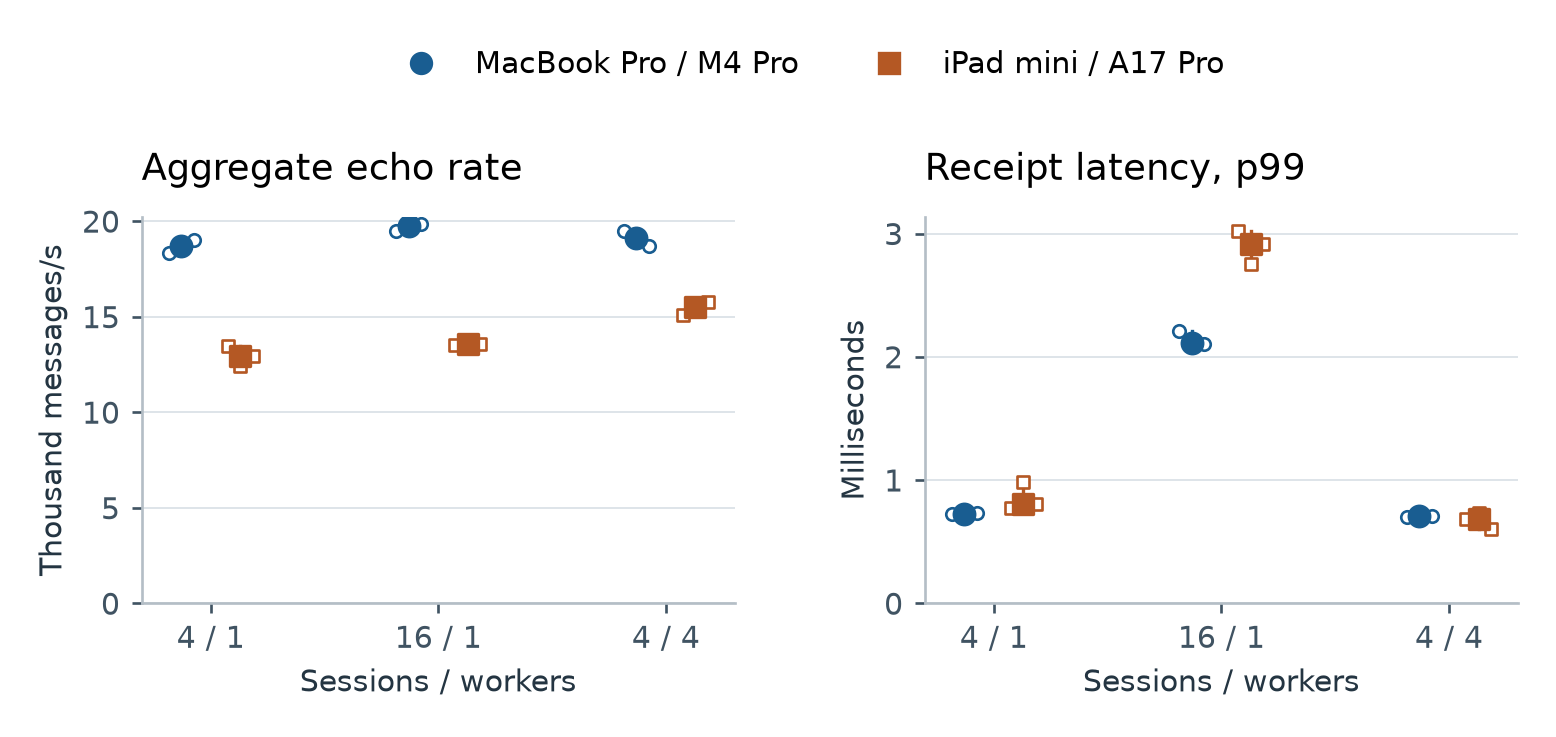
Each session sends a 64-byte message, receives and verifies the echo, then acknowledges it before sending the next message. Sessions begin their measured loops at a shared barrier.
| Sessions / workers | Mac msg/s | Mac p50 | Mac p99 | iPad msg/s | iPad p50 | iPad p99 |
|---|---|---|---|---|---|---|
| 4 / 1 | 18,696 | 130.2 | 727.8 | 12,951 | 200.2 | 805.5 |
| 16 / 1 | 19,778 | 704.2 | 2,110.1 | 13,580 | 1,039.8 | 2,919.1 |
| 4 / 4 | 19,150 | 128.1 | 706.9 | 15,513 | 165.1 | 684.0 |
Table 3. Median message rates and receipt percentiles. Latency is in microseconds. Four-session trials use 2,000 measured messages per session; sixteen-session trials use 1,000.
With four sessions, moving from one worker to four increased the median message rate by 19.8% on iPad and 2.4% on Mac; these measurements do not identify the limiting component.
Completion and a paused consumer
In the final cohort, all three standard sixteen-session trials and ten additional trials completed on each device. Separate delayed-consumer trials pause consumption for 500 ms, then verify the remaining output and complete shutdown.
| Output credit | Mac queue high-water | iPad queue high-water | Trials / device |
|---|---|---|---|
| 64 KiB | 64 KiB | 64 KiB | 3 |
| 1 MiB | 1 MiB | 1 MiB | 3 |
Table 4. Observed queue high-water during delayed-consumer trials. Each trial sends 1,024 frames of 16 KiB after 30 warmups.
Idle-session snapshots
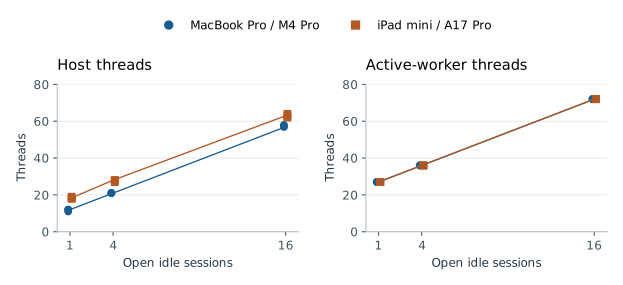
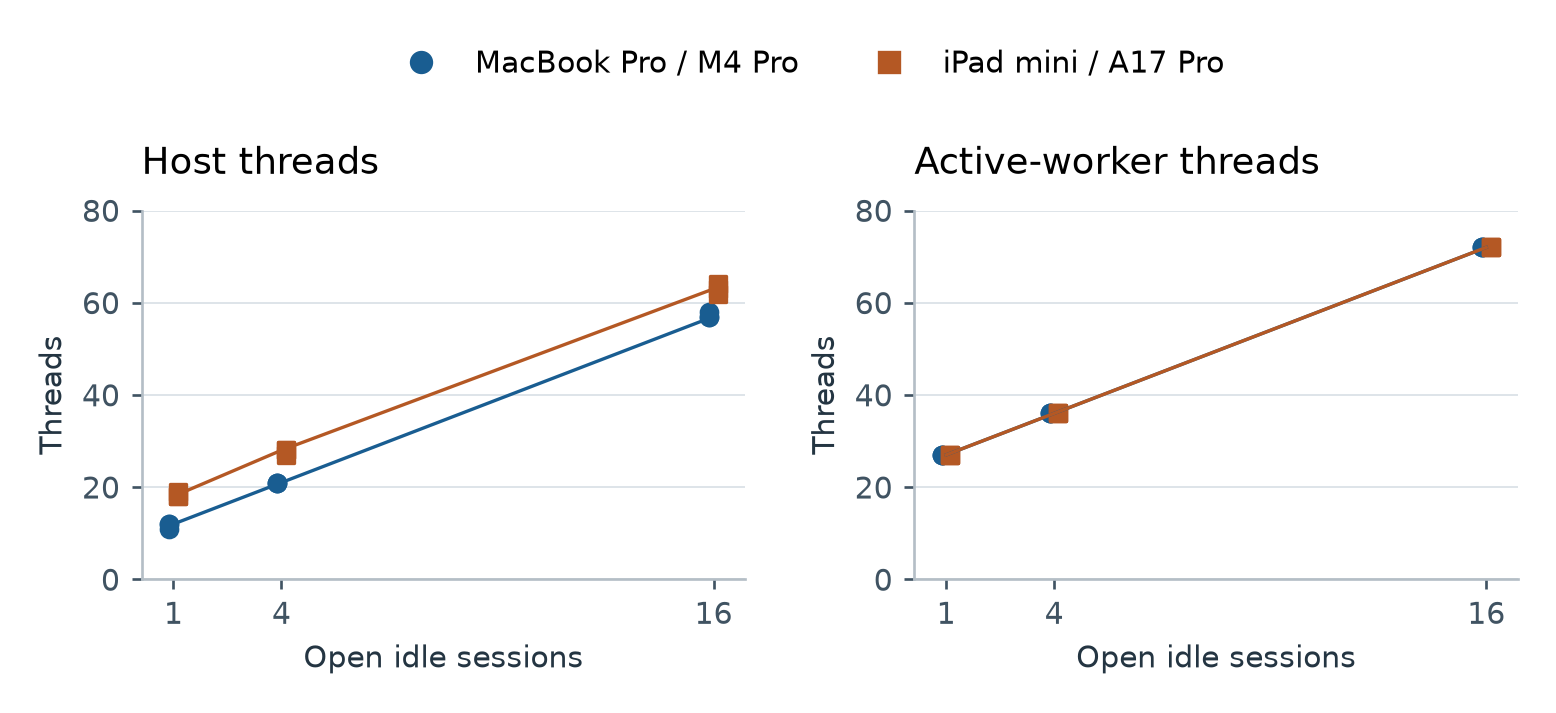
One worker is measured before sessions open, with sessions open, and after they close. The table pairs the first two snapshots. The figure shows the open-session counts.
| Device | Sessions | Host threads | Worker threads | Host RSS, MiB | Worker RSS, MiB |
|---|---|---|---|---|---|
| Mac | 1 | 8 / 12 | 24 / 27 | 31.0 / 34.8 | 41.5 / 42.2 |
| Mac | 4 | 8 / 21 | 24 / 36 | 30.9 / 41.2 | 41.5 / 42.5 |
| Mac | 16 | 8 / 57 | 24 / 72 | 31.0 / 66.8 | 41.3 / 44.2 |
| iPad | 1 | 15 / 18 | 24 / 27 | 123.3 / 125.3 | 42.8 / 43.3 |
| iPad | 4 | 16 / 28 | 24 / 36 | 123.2 / 131.5 | 42.8 / 43.7 |
| iPad | 16 | 15 / 63 | 24 / 72 | 123.2 / 156.7 | 42.8 / 45.3 |
Table 5. Before / open, medians of three trials. RSS is resident set size, not peak allocation or exclusive ownership. MiB is 1,048,576 bytes.
Sampling
Mac RSS comes from process snapshots; iPad RSS and thread counts come from Mach queries within each process. The iPad host includes SwiftUI and extension hosting. Its standby extension is outside the active-worker figures. Absolute host memory therefore describes different application setups.
Thread counts returned close to their starting values after sessions closed. Memory snapshots were taken before process exit. Every selected trial also checked that the benchmark worker processes had exited.
Measurement method
Data and timing
The payload is a repeated byte sequence, without compression. Python echoes the input, and Swift compares every returned byte. Elapsed time uses the monotonic uptime clock. Bulk intervals include send, echo, verification and acknowledgement. Latency samples end at receipt; full-cycle samples include verification and acknowledgement.
| Payload | Mac full-cycle p50, µs | iPad full-cycle p50, µs |
|---|---|---|
| 64 B | 91.4 | 110.2 |
| 1 KiB | 91.6 | 111.0 |
| 16 KiB | 100.8 | 132.6 |
| 256 KiB | 221.1 | 315.5 |
Runs and aggregation
Each trial uses fresh processes. Startup, warmup and the iPad's 11-second relaunch wait are outside measurement. Cases are shuffled within suites using seed 20260929. Builds do not overlap measurement.
Tables report medians of trial statistics, including trial p99s. Ranges span observed minima and maxima, not confidence intervals. Counts below are configurations × repeats. *Concurrency lists sessions/workers.
| Suite | Measured frames / session | Warmup frames | Trials / device |
|---|---|---|---|
| Latency: 64 B / 1 KiB | 25,000 | 100 | 2 × 5 = 10 |
| Latency: 16 KiB / 256 KiB | 15,000 / 5,000 | 100 / 50 | 2 × 5 = 10 |
| Bulk: five settings in Table 2 | 131,072 / 65,536 / 32,768 | 100 / 100 / 30 | 5 × 5 = 25 |
| Managed: 256 KiB / 1 MiB | 65,536 / 32,768 | 100 / 30 | 2 × 3 = 6 |
| Concurrency: 4/1, 16/1, 4/4* | 2,000 / 1,000 | 100 | 3 × 3 = 9 |
| Additional 16-session runs | 1,000 | 100 | 1 × 10 = 10 |
| Idle: 1 / 4 / 16 sessions | No measured traffic | 0 | 3 × 3 = 9 |
| Paused consumer: two credits | 1,024 | 30 | 2 × 3 = 6 |
| Total per device | 85 |
Cohort and scope
The comparison uses the final 85-trial cohort from each device. Earlier source and setup trials, smoke tests, and instrumented follow-ups are outside these cohorts. No observation within either selected cohort was removed. Background system services remained active. All recorded iPad thermal samples were nominal.
Hardware, OS, Python version and worker hosting differ. The tables compare complete platform setups; they do not isolate any one of those factors. Measurements were collected on 29-30 September 2026 UTC. Per-trial statistics and parameters accompany this report in data.json.
Figures
Download the vector figures: latency, throughput, concurrent sessions, idle sessions.